Our global ecological footprint
Measuring our impact on the environment from global to individual (Part 1)
Overconsumption of the Earth’s natural resources as inputs into the economy is a driver of climate change and other destruction to the environment. It can be difficult to comprehend where, how, and how much change is needed in our complex globalized economic systems. Yet being able to quantify and measure humanity’s impact on the environment in relation to economic systems is vital to see progress and be able to prescribe change. The concept of measuring our impact on the environment has been expressed through the concept of ‘footprints’. Walking in the grass or sand we see the footprints we make, but our footprints from what we produce, consume, and waste are not as clear. We are now seeing the effects of these footprints as our climate and environment are in crisis.
One of the most popularized footprints is the ‘carbon footprint’ that measures the total carbon emissions. This is most commonly used for individuals through the form of a carbon footprint calculator. However, the carbon footprint is limited in scope by focusing only on carbon emissions. We have many other impacts on the environment, such as overconsumption, water shortages, and resource scarcity among other things. This limited scope is termed “carbon tunnel vision”. As humans we have many other impacts on the environment – many other footprints – beyond the pollution of the atmosphere from carbon and greenhouse gas emissions.
Another type of footprint, ‘ecological footprint’, provides a more holistic perspective of human impacts on the environment. Ecological footprint accounts for humanity’s impact on the environment as a measurement of the land that is needed to sustain our economic systems. This includes, the amount of land needed to grow crops that we eat and that feeds the livestock we eat, the amount of land needed to grow trees that we consume as products made from pulp and timber, the amount of land our built environments take up, and the amount of water needed to harvest and catch the amount of fish we eat. All of this is split into six components of ecological footprint – cropland, grazing land, forest land, fishing grounds, built-up land, and carbon. For definitions of the ecological footprint components, refer to the Global Footprint Network Glossary.
Ecological footprint is measured for a given space, time, and population. For instance, there is the ecological footprint of the world in 2022, the ecological footprint of Canada in 2010, or the ecological footprint of the City of Toronto in 2020. Ecological footprint is measured in a unit called, ‘global hectares’, an area-based metric that provides the global average amount of productivity for each land type. Applying a global average amount of productivity allows for different environments, spaces, and times to be comparable, for example one can compare the size of the cropland component to the carbon component within an ecological footprint. Comparisons can also be made between times and spaces. The ecological footprint of Canada can be compared across a timeline, or the ecological footprint of the United States can be compared to the ecological footprint of China in one year.
Arguably, the most important comparison that’s possible using ecological footprint is to biocapacity. Biocapacity is defined as the amount of area that is available of the Earth’s lands and waters to supply natural resources. Ecological footprint tells us the size of our foot and biocapacity tells us what shoe sizes we have available. Ecological footprint and biocapacity are made up of almost the same components, the only difference being that there is no carbon component for biocapacity, because forested land has the dual purpose of measuring the availability of forest products and storing carbon.
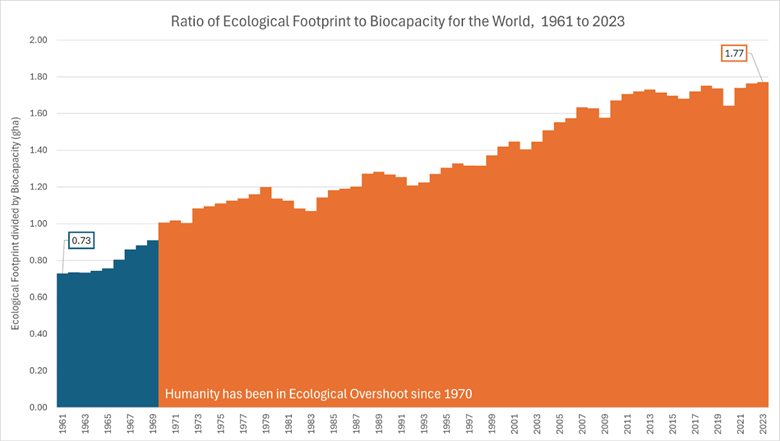
This framework of ecological footprint and biocapacity allows us to understand the impact we are having on the environment and how it’s connected to our economic systems. An impressive feat of this metric is that there is timeline data available for every country in the world – and its open access! Researchers at the Ecological Footprint Initiative at York University in Toronto, Canada produce a new edition of the National Ecological Footprint and Biocapacity Accounts (National Accounts) every year. The National Accounts include data for 244 countries and the world, from 1961 up to the last present year of that edition of data. The 2024 edition was released in June 2024 and that includes data from 1961 to 2023. Figure 1 presents the ratio of ecological footprint to biocapacity for the world from 1961 until 2023. The blue bars show when the world had an ecological footprint less than the available world biocapacity, while the orange shows when humanity’s ecological footprint grew beyond the available biocapacity for that year. When the ecological footprint of humanity is beyond the world's biocapacity we are in ecological overshoot.
It's evident from the graph that there needs to be changes to our consumption patterns and economic systems on a global scale to be able to reduce our ecological footprint to be within biocapacity, the Earth’s ecological limits. This consumption is not equal around the world – developed countries continue to have much larger ecological footprints per capita than less developed countries, this is evident from the national level data. This data allows us to comprehend the complexity of our globalized economies and see the impact it has on our home planet. Our ecological footprint continues to grow to be almost double the size of our shoe, instead of looking for a bigger shoe let’s start to reduce our footprint.
Figure 1: Comparing ecological footprint to biocapacity as a ratio for the world as a summation of all countries from 1961 to 2023. The data used to generate this graph is sourced from the National Ecological Footprint and Biocapacity Accounts.
Photo by Joel Rohland


